Top .01% Super Wealthy Americans

Top 0.01% of Super Wealth Americans  Gain as Income Clusters at Peak

Boom and Bust Man

Boom and Bust Man

It was the biggest share of income clustered at the very top of the distribution scale since 1929.
Richard Rubin  May 27, 2015 — reprinted here from Bloomberg Politics News

The top 0.01 percent of Americans — fewer than 14,000 households — received 5.6 percent of adjusted gross income in 2012, according to data released Wednesday by the IRS that underscore the increasing concentration of income.
It was the biggest share of income clustered at the very top of the distribution scale since 2007. Those in that group had a minimum income of $12.1 million, up from the $8.8 million it took to reach that club in 2011.
An even more exclusive club — the top 0.001 percent — also had its best year since 2007.
“The middle class really has stagnated.”  Harry Stein

Greed and Wealth

Greed and Wealth

The average tax rate of that group — with a minimum income of $62.1 million — was 17.6 percent. That’s lower than the average rate for the top 10 percent of the U.S. population, a demonstration of the power of preferential tax rates on investment income.
The Internal Revenue Service data provide fodder for the 2016 presidential campaign, with candidates from both parties searching for policies that would reduce income inequality.
Measured in inflation-adjusted dollars, the threshold needed to be in the top 50 percent of the income distribution declined from 2003 to 2012.
“The middle class really has stagnated,” said Harry Stein, director of fiscal policy at the Center for American Progress, a Washington group aligned with Democrats. “You see people at the top doing very well, and it’s not trickling down to anybody else.”
Unusual Situation
High earners faced an unusual tax situation in 2012, because it was the end of the 15 percent top rate on capital gains and dividends. The increase to 23.8 percent on Jan. 1, 2013, prompted many high earners to sell appreciated assets before the deadline and take advantage of the lower rates.
The IRS report also shows how the U.S. tax system remains broadly progressive — meaning those with higher incomes pay higher tax rates. The top 3 percent of households, who received 30.9 percent of adjusted gross income, paid more than half of individual income taxes. And that was before tax increases for top earners took effect in 2013.
Because of tax credits that operate as wage supports, relatively few households in the lower half of the income distribution pay income taxes. The top 50 percent of households received 89 percent of the income and paid 97 percent of the income taxes.
Payroll taxes and state taxes are typically regressive and counteract the leveling effect of the federal income tax.  Income Inequality  and PDF of report here 

Investors Pessimistic Over Stock Market

Investors Pessimistic Over Stock Market

Equity sentiment is plunging at a historic rate, falling by some measures at the fastest pace since Federal Reserve Chairman Paul Volcker pushed up interest rates in the 1980s.
Reprinted from Bloomberg here.
Equity sentiment is plunging at a historic rate, falling by some measures at the fastest pace since Federal Reserve Chairman Paul Volcker pushed up interest rates in the 1980s.

Investors hate stocks — again.

Amid a six-year bull market that’s notable mainly for how little conviction there is in it, equity sentiment is plunging at a historic rate, falling by some measures at the fastest pace since Federal Reserve Chairman Paul Volcker had just finished pushing up interest rates in the 1980s. The cost to hedge against stock losses is soaring, valuations are contracting, and bearishness among professional stock handicappers is rising the most in three decades.

stocks

Fret not. All of this is good news for bulls, if history is any guide. Since 1963, the Standard & Poor’s 500 Index has advanced an average 11 per cent in the year after newsletter writers surveyed by Investors Intelligence were as pessimistic as they are now, data compiled by Bloomberg show. That compares with an annualized return of 8.3 per cent.

S&P 500 futures expiring in December rose 0.2 per cent at 10:32 a.m. in London.

This is the least-believed economic recovery and the least-believed bull market of our careers

Skepticism is one thing the rally since 2009 hasn’t lacked — and it may be the best thing stocks have going for them as corporate profits fall, concerns deepen over China’s travails, oil and commodities plunge and the Fed turns more pessimistic on global growth. Some traders even say they see bargains after S&P 500 posted its first 10 per cent retreat in four years.

‘Least-Believed’

“This is the least-believed economic recovery and the least-believed bull market of our careers,” said Bob Doll, chief equity strategist at Chicago-based Nuveen Asset Management, which oversees US$130 billion and bought stocks during the August selloff. “The nervousness means people have stepped to the sidelines. The question is, who is left to sell? Everybody who has cash is a potential buyer.”

Investors have bailed out of stocks at every sign of trouble since 2009, from the euro crisis to ebola, with the latest catalyst coming from China’s devaluation of its currency. The distrust has been a barrier to euphoria, a quality that historically is the bigger threat to bull markets.

Fear reigns, spreading faster than any time since 1984 as the S&P 500 tumbled 10 per cent over four days in August. At the start of this month, the bull-to-bear ratio in Investors Intelligence’s survey of newsletter writers fell to a four-year low of 0.9. In April, when bulls dominated the market that was heading for an all-time high, the ratio reached 4.1.

Options, Shorts

The S&P 500 fell last week, as the Fed left interest rates near zero, sparking concern over the strength of the global economy. The benchmark index for equities has declined 4.9 per cent this year and is down 8.1 per cent from its record 2,130.82 reached in May.

Pessimism prevails among options traders and speculators, too. The cost of puts protecting against a 10 per cent drop in the S&P 500 rose to a record on Aug. 24 relative to calls betting on a 10 per cent rally, according to three-month data compiled by Bloomberg. While the spread has retreated to 12.76, it’s still up 30 per cent from three months ago and higher than 99 per cent of the time since 2005.

In futures tracking the S&P 500, bearish contracts outnumber bullish ones by the most in three years, data from the Commodity Futures Trading Commission show. Speculators increased short positions in stocks to the highest level since March 2009, according to data compiled by U.S. exchanges.

stocks2

“When everyone is bearish, everyone is shorting and hedging, it’s generally a contrarian sign,” said David Kalis, co-chief investment officer who helps oversee US$23.2 billion at Calamos Investments in Naperville, Illinois. The firm recently bought technology shares. “People are already positioned negatively so if anything goes right, markets can really have a good move.”

This bull market has seen the biggest rallies after periods of the worst sentiment. Bearish newsletter writers surpassed bullish ones three other times during the last 6 1/2 years, in April 2009, August 2010 and October 2011. All turned out to be buying opportunities as the S&P 500 rallied for two straight quarters each time, with gains exceeding 20 per cent.

The last time sentiment soured as fast as it is now was June 1984, when the S&P 500 was close to completing a nine-month decline that was overshadowed by another round of rate hikes spearheaded by Volcker to tame inflation. As the Fed began easing in October, stocks advanced in the next five years.

Fed Decision

The Fed last week refused to raise interest rates, saying that economic and financial developments around the world may restrain economic activity and curb inflation. Chair Janet Yellen mentioned the outflow of capital from developing countries and pressures on emerging market currencies in her Q&A session.

While not sharing investors’ pessimism, Jeff Carbone at Cornerstone Financial Partners said he’s watching signs of further deterioration in sentiment to determine whether to trim stocks. His firm has bought technology and health-care companies in the past month after valuations shrank, reducing cash by about half.

“If the market drops another 5 per cent, we want to dive deeper into, ‘is there a change in the economy?’” said Carbone, who oversees about US$1.1 billion as the founder of Cornerstone in Charlotte, North Carolina. “Sentiment is something you’ve always got to look at — did we miss something? If you are not in business long, you miss a lot.”

U.S. Strength

Bears obsessed with China and oil fail to recognize the strength in the U.S. economy, according to Jason Pride, director of investment strategy at Glenmede which oversees US$30 billion. U.S. unemployment has fallen to the lowest level in seven years, housing and auto sales are booming and rising retail sales signal that consumers may be looking past recent volatility in financial markets.

While falling oil and the rising dollar are forecast to weigh on 2015 earnings, analysts predict profit will rebound in the next two years, estimates compiled by Bloomberg show. At its worst point last month, the S&P 500 traded at 16.5 times earnings, down 12 per cent from its July peak.

Concern over China and emerging markets “are likely to be proven misplaced over the next six to 12 months because the underlying picture isn’t as dire as people are worried about today,” Pride said by phone. “The correction pushes people to the line, saying ‘I’m not as bullish as I was two months ago,’ whereas in fact, the valuation perspective on it is ‘everything is cheaper, you should probably like it more now.’”
Bloomberg.com

reprinted here from Bloomberg

Relax -Stocks Are Just Correcting -False

This Market Is a “Wheelbarrow of Dynamite” Waiting to Blow

But in come the cronies to tell us not to worry about it.

By Bill Bonner    reprinted Wolfstreet article

DELRAY BEACH, Florida – It’s hot in Florida. Steamy hot. Hair curls and bodies go limp.

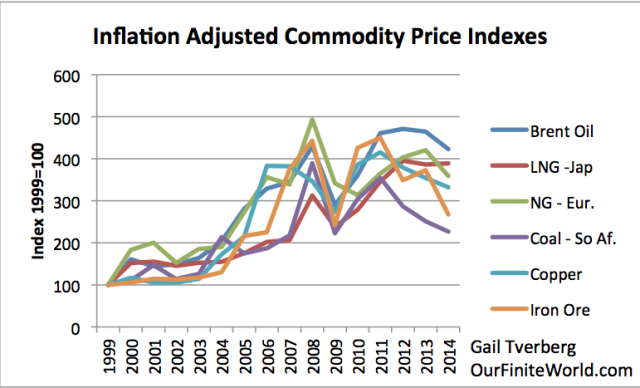
The “relief rally” continued yesterday. All over the world, stocks gained. So did oil and commodities. (More on that below in today’s Market Insight.) The Dow was up 369 points – a 2.3% move. Chinese stocks were up by about 5%. Why?

U.S. GDP numbers for the second quarter came out higher than expected. The economy grew by an annual rate of 3.7%. And influential New York Fed chief William Dudley said the argument for a rate increase in September was “less compelling.”

A Decline in Excess of 50%

Oh, ye of little faith… fear not! Things are happening just as they should. It is the end of summer. Markets are giving strong hints of things to come in the fall. Like Vesuvius, a plume of smoke rises… and a cloud of dust hangs over the markets. The economic earth rumbles… and animals take flight.

But in come the cronies to tell us not to worry about it.

And who knows what happens next?

Your editor is a fairly good plumber. He can put the pipes together and unclog the toilet. Alas, his record as a market soothsayer is spotty. He is rarely wrong, but often so early that by the time the event occurs even he has forgotten he ever predicted it.

But today we are encouraged and emboldened. We swagger ahead, like a reedy poet into a rough bar, confident in the knowledge that there are giants behind us. Yes, economist and money manager John Hussman’s forecast is similar to our own. From his most recent note for Hussman Fund clients:

If you roll a wheelbarrow of dynamite into a crowd of fire jugglers, there’s not much chance things will end well. The cause of the inevitable wreckage is not the dynamite, but the trigger is the guy who drops his torch.

Likewise, once extreme valuations are established as a result of yield-seeking speculation that is enabled (1997-2000), encouraged (2004-2007), or actively promoted (2010-2014) by the Federal Reserve, an eventual collapse is inevitable.

By starving investors of safe return, activist Fed policy has promoted repeated valuation bubbles, and inevitable collapses, in risky assets.

On the basis of valuation measures having the strongest correlation with actual subsequent market returns, we fully expect the S&P 500 to decline by 40% to 55% over the completion of the current market cycle. The only uncertainty has been the triggers.


A $12 Trillion Wealth Wipeout

A “decline in excess of 50%” within “less than three years” is our forecast.

We will stick with it, hoping to live long enough to see it proven correct, or in any case hoping to live long enough to see how it turns out.

But this forecast is for real (adjusted for inflation) prices, not nominal prices. Because we have a feeling that the feds will not stay in their seats as the government loses revenues, zombies rise in rebellion, and cronies and campaign contributors lose much of their net worth.

As of this May, the combined market cap of the companies listed on the New York Stock Exchange was $19.7 trillion. A 50% plunge would wipe out about $10 trillion in investor wealth, give or take a few billion dollars. More “reflationary” monetary policies are no doubt in the pipeline. Real estate would most likely go down, too – especially at the upper end.

The house in Florida on the market for $139 million that we reported on last week, for example, would have to be sold at auction. How much would it bring? $10 million? $50 million? Who knows?

Debt in Distress

The junkiest, riskiest part of the bond market would also be destroyed. When the going gets tough, the “spread” (or gap between yields) on junk bonds over U.S. Treasury bonds widens, as bond investors bail out of their riskier positions.

Whole sectors could go broke. Here’s Bloomberg with a report on debt in the oil patch:

At a time when the oil price is languishing at its lowest level in six years, producers need to find half a trillion dollars to repay debt. Some might not make it.The number of oil and gas company bonds with yields of 10% or more, a sign of distress, tripled in the past year, leaving 168 firms in North America, Europe, and Asia holding this debt, data compiled by Bloomberg show. The ratio of net debt to earnings is the highest in two decades.

If oil stays at about $40 a barrel, the shakeout could be profound.

Easy come. Easy go. It doesn’t take too much imagination to see the EZ money of the last seven years going back where it came from – to nowhere.

Forward – to Disaster

And then, what would Saint Janet do?

Even now, under less stressful conditions (let us assume that markets stay calm), will she raise rates next month as expected? Probably not…

Consumer prices, as officially measured, are stable, not rising. And inflation expectations have dropped to a five-year low. Unemployment and GDP numbers make it look as though the economy is running okay. But don’t look under the hood!

And with the stock market so fragile, would Saint Janet risk being the one to cause a worldwide panic? Nah… No rate increase in September.

Instead, when the crash resumes, we will see even EZ-ier money, not tighter money. We are on course for a “hormegeddon”-style outcome. (Hormegeddon is the term I coined in my latest book for “disaster by public policy.”) Backing up is not an option. We must go forward – to disaster. By Bill Bonner, Bonner & Partners

Markets bounced over the last few days. But is the bounce to be trusted? Read… “The Most Astounding Credit Binge in History”

Share on FacebookTweet about this on TwitterShare on LinkedInShare on Google+Share on RedditPrint this pageEmail this to someone

  16 comments for “This Market Is a “Wheelbarrow of Dynamite” Waiting to Blow”

  1. ERG
    August 29, 2015 at 9:41 am

    Please: if the Dow isnt at, say, 9,000 by the end of October, can we ease up on the Sky Is Falling Stuff? In the next two or three months we will get to see if the time is actually ripe for a 40 percent correction and if the Fed will or will not do anything about it – before or after it (maybe) happens.

    My interest in this is more along the lines of morbid curiosity as I think our economy has been ruined nearly beyond repair. That means I consider the current process of destroying the middle class to already be so far along that, functionally, the stock market is now mostly an indicator or economic dysfunction. Even if it never crashes.

    • Winston
      August 29, 2015 at 9:52 am

      “the stock market is now mostly an indicator or economic dysfunction”

      Agreed. It began to approach something resembling reality on Monday, but didn’t remain there:

      http://www.zerohedge.com/sites/default/files/images/user3303/imageroot/2015/08-overflow/20150828_EOD1.jpg

    • August 29, 2015 at 10:10 am

      But wait… if the Dow is at “9000 by the end of October,” WOLF STREET will turn bullish on stocks.

      Remember, WOLF STREET turned bearish on stocks in early 2014, after turning bearish on junk bonds in mid-2013 (too early), though I called both in a “bubble” before then. WOLF STREET is not a perma-bear site. But it does try to point at the next crisis.

      For example, I started writing about Cyprus 1.5 years before it blew up. When it blew up, NPR said that it “came out of nowhere.” Clearly, they don’t read WS :-]

      But I don’t think we’ll be handed this unique trading opportunity of the DOW plunging to 9000 by October. That would be too easy.

      • Brit
        September 1, 2015 at 6:33 pm

        Mr. Richter,

        I’ve enjoyed your analysis very much.

        Now that valuations are beginning to reflect your worldview, do you see a bull market anywhere? CDs aren’t paying too well.

        • September 1, 2015 at 6:43 pm

          I don’t see a bull market in equities yet. They would have to drop a lot further for me to see one. In the US, the S&P 500 is barely in a mild correction, after rallying incessantly since 2011. I’m looking forward to the day that I can see a bull market, but I’m afraid it’s going to be a while.

          Meanwhile I think this is the most treacherous market I’ve ever seen before.

    • Vespa P200E
      August 29, 2015 at 10:40 am

      Agree – “That means I consider the current process of destroying the middle class”

      Global CBs under orders from the bankster cabal handlers are doing just that. Suck blood from middle class while 1% gets wealthier and rising ranks of poor dependent on governments (who in turn tax the middle class more) which are becoming more socialistic (Marx would be proud) even though EU socialist agendas proved to be failure. Bet Government Sacks and alike already know the market is about to tank and already lined up trades against its muppet clients.

      Here is an interesting article from conservative American Thinker as it dissects China and market meltdown

      1st paragraph: “The ongoing stock market meltdown is just the tip of the iceberg that is the dangerously precarious China economy. The back story — the extraordinary market manipulation that has allowed the global economy to come to this potentially disastrous pass — is what few commentators have yet spelled out.”

      http://www.americanthinker.com/articles/2015/08/_the_china_syndrome.html

  2. Vespa P200E
    August 29, 2015 at 10:31 am

    Helicopter Benny’s departure was very timely before the excrements hit the fan. So Janet got her wish but alas she was left with molasses to deal with.

    She was like deer in headlight being newbie to the job and weight on top of her as leader of global CB cabal and more like circus. So she chose to stand by as why raise the rates and have all banksters come after her head? Fast forward to Aug and she is now stuck in rock and a very hard place with USD spiraling up against just about every currency but raising int rate would only strengthen the USD with so many herd mentality went long on USD. Add to this China Syndrome kicks in full gear in Aug.

    Ah to be (raise rate) or not to be but I bet Janet will stand pat till things really fall apart in Sept/Oct then try to unleash QE IV only to see it fail in light of Chinese selling Treasuries in the tunes of $1 trillion countering QE IV’s limp impact.

  3. Petunia
    August 29, 2015 at 10:39 am

    The market is overvalued and the underlying products and services they represent are also extremely overvalued. The reality is that people don’t have the money anymore to support the price levels these valuations require and there is heavy discounting going on, which is never reflected in the market valuations. If you look at all the mergers gone bad that is where you can really see it. Companies keep trying to buy growth but it is just not there. What is there is the hidden discounting which they think they can consolidate their way out of. Eventually they unload the bad deal as a write-off and they don’t have to admit that they don’t have the revenue or the pricing power.

    • Ray Phenicie
      August 29, 2015 at 8:23 pm

      Also look at the amount of stock purchasing going on. If making a short term profit appear on the quarterly report is more important, if making the stock value stay ahead of the pack, then go ahead Mr. Cif, authorize those buybacks. But if the future well being of your entity is your chief concern then invest in research and development, or your employees but not your own stock. The snake that eats its own tail eventually reaches the back of its own head.

  4. LG
    August 29, 2015 at 11:28 am

    “The economy grew” !? Come on people its not the economy, it’s debt and inflation!
    GDP is mostly debt based synthetic growth! Thus the inflation that the banks and the tax man loves so much!

    • Thete
      August 29, 2015 at 7:51 pm

      Debt and inflation go up when the economy is growing

  5. Julian theApostate
    August 29, 2015 at 6:04 pm

    The market believes the “growth” number because it helps them blank out the elephant in the room. Swimming against this current is like battling the tar baby, getting pulled in deeper with each blow. Maybe the sky isn’t falling, but if it walks like a duck and quacks like a duck…it’s probably a DUCK.

  6. ERG
    August 29, 2015 at 7:38 pm

    That’s my point, friends: the sky does not have to fall re the stock ‘market’ for the process of taking the middle class to the cleaners to continue its advance. Even if you have been wise enough to avoid/minimize your ‘market’ exposure before or since 2008, you’ve still been washed, dried, fluffed, and folded. Just go food shopping or try looking for a job.

  7. Pete from Delray
    August 29, 2015 at 7:49 pm
  8. Brett
    August 30, 2015 at 3:44 am

    I find I have been watching a lot of documentaries on the 1929 crash and the subsequent depression recently, similarities to the current belief in the stock market are scary, especially the purchase of shares on margin.

  9. Paul
    August 30, 2015 at 9:48 am

    Retired investors have to put estate somewhere. While the stock market is suspect so are the alternatives. Cattle anyone?

Chinese Paper Value Now Plunging

‘Chinese Paper’ Now Plunging in Value

My father, a New York financier, used to call dubious stocks or bonds,  “Chinese paper.”   Last week, we saw a blizzard of  Chinese paper, both in China and around the world.

As manager of a sizeable investment portfolio (an unwelcome second job from my main work, journalism),  I watched last week’s near death experience on world markets with a mixture of cynicism and alarm.

First of all, remember when Americans – and particularly Republicans – demonized Mao’s China and endlessly warned about the perils of Communism?

Well, the Chinese seemed to have listened.  China ditched Communism and embraced runaway capitalism – or at least a hybrid of 1900 raw capitalism and state socialism.  But Chairman Mao was proven right. He warned his people against the evils of “casino capitalism” and money lending.

The near collapse of China’s stock market in recent weeks scared the hell out of the entire world but, at least so far, really has not mattered very much.  China’s markets are insulated from the rest of the world.  They serve as a way of letting average people share some of China’s growth and as a form of national lottery – call it Beijing bingo.

Western stock markets are also semi-rigged casino games in which the big boys and their ultra high speed computer systems almost always win at the expense of small fry.

Speculating on the New York or London markets is akin to what Samuel Johnson’s famous quip about lotteries: “a tax on fools.”   But compared to China’s crazy markets, New York and London look like Presbyterian church raffles.  Chinese are a nation of frantic gamblers.

What is truly of concern about China is the dangers of implosion of its banking sector and the slowing of economic growth.   China has been steaming along at 10% growth per annum; now it’s down to a mere 7%, a rate western nations can only dream of achieving.   If China could but sustain 7%, that would be dandy.   But it likely will not. China’s raw material import boom is finished.  So watch out Canada, Australia, Brazil, Peru, and Africa.

In fact, I have long wondered about China’s economic reporting.  Based on my 16 years of doing business in China,  I don’t trust Beijing’s happy-face economic statistics or its banks.

China is the Wild East.  Its business rules are mostly made up on the fly.  I first went to China in 1975. The Great Cultural Revolution was still raging.  Mao was gravely ill.  His Gorgon of  a wife, Jiang Qing – known to Chinese as “the White Boned Devil”) was leading the notorious Gang of Four trying to stamp out Marxist-lite counter-revolutionaries. China was in chaos.  But at least it had no stock market problems.

Ever since Deng Xiaoping took command of China and decreed  “it does not matter what color cats are as long as they catch mice,” China has vented its long-restrained commercial powers.  The incredible growth of China’s economy since 1991 is unprecedented in history, a true “stupor mundi.”

Of course, this growth came from near zero.  When I first started going to China everyone wore threadbare Mao suits and subsisted in profound poverty.   Today, China is said to be the world’s second largest economy.

South Korea performed an equally amazing rise from rags to riches.  Both nations hugely benefitted from being granted access to the mighty US market.

I’ve always wondered where did all the money come from? A sea of credit was created by the Party’s banking system.  As a result, China embarked on the biggest building programs in history.  I recall in the lovely northern city of Dalian watching workers go round the clock putting up apartment buildings with marble floors and halls.

Finance came from state and local banks – thank you Communist Party. Or from thin air.

China’s orgy of buildings, airports, new cities, harbors, highways, high-speed trains was all financed by “Chinese paper”  and overseas Chinese money. Today, no one knows how much bad debt is choking China.  My sense is that one of these days the whole credit house of cards may come crashing down, igniting another worldwide panic.  I instructed my money mangers to stay out of Chinese investments three years ago.

Asian stocks dependent on exporting to China are in big trouble.  America’s near death experience in 2008 was the result of far too much credit which had become a sort of amphetamine drug for the economy.

The financial witch doctors at the Federal Reserve in Washington artificially inflated the equity market by so-called monetary easing (aka printing money).  Savers were punished, lenders rewarded.

Last week, many stocks inflated by the Federal Reserve came crashing down as all the hot air that had pumped them up rushed out of the market.

The same holds true for China.

China needs another generation to master the difficult juggling act of capitalism.  But Chinese, who are by nature brilliant businessmen, will learn.  Right now, however, they should take a breather and straighten out the big financial mess at home.

China is not about collapse.  As the French say, “take a step backwards to better leap in advance.”

The US seems poised for growth – if its useless Federal Reserve central bank will just get out of the way.  Interest rates must come up to restore market stability.  We can’t blame all our problems on China.   Rather, on our own Great Wall of Chinese Paper.

https://www.lewrockwell.com/2015/08/eric-margolis/beijing-bingo/ reprinted here

The Beginning of Deflationary Depression

Why are commodity prices, including oil prices, lagging? Ultimately, the question comes back to, “Why isn’t the world economy making very many of the end products that use these commodities?” If workers were getting rich enough to buy new homes and cars, demand for these products would be raising the prices of commodities used to build and operate cars, including the price of oil. If governments were rich enough to build an increasing number of roads and more public housing, there would be demand for the commodities used to build roads and public housing.
It looks to me as though we are heading into a deflationary depression, because the prices of commodities are falling below the cost of extraction. We need rapidly rising wages and debt if commodity prices are to rise back to 2011 levels or higher. This isn’t happening. Instead, Janet Yellen is talking about raising interest rates later this year, and  we are seeing commodity prices fall further and further. Let me explain some pieces of what is happening.
1. We have been forcing economic growth upward since 1981 through the use of falling interest rates. Interest rates are now so low that it is hard to force rates down further, in order to encourage further economic growth. 
Falling interest rates are hugely beneficial for the economy. If interest rates stop dropping, or worse yet, begin to rise, we will lose this very beneficial factor affecting the economy. The economy will tend to grow even less quickly, bringing down commodity prices further. The world economy may even start contracting, as it heads into a deflationary depression.
If we look at 10-year US treasury interest rates, there has been a steep fall in rates since 1981.

Figure 1. Chart prepared by St. Louis Fed using data through July 20, 2015.
In fact, almost any kind of interest rates, including interest rates of shorter terms, mortgage interest rates, bank prime loan rates, and Moody’s Seasoned AAA Bonds, show a fairly similar pattern. There is more variability in very short-term interest rates, but the general direction has been down, to the point where interest rates can drop no further.
Declining interest rates stimulate the economy for many reasons:
  • Would-be homeowners find monthly payments are lower, so more people can afford to purchase homes. People already owning homes can afford to “move up” to more expensive homes.
  • Would-be auto owners find monthly payments lower, so more people can afford cars.
  • Employment in the home and auto industries is stimulated, as is employment in home furnishing industries.
  • Employment at colleges and universities grows, as lower interest rates encourage more students to borrow money to attend college.
  • With lower interest rates, businesses can afford to build factories and stores, even when the anticipated rate of return is not very high. The higher demand for autos, homes, home furnishing, and colleges adds to the success of businesses.
  • The low interest rates tend to raise asset prices, including prices of stocks, bonds, homes and farmland, making people feel richer.
  • If housing prices rise sufficiently, homeowners can refinance their mortgages, often at a lower interest rate. With the funds from refinancing, they can remodel, or buy a car, or take a vacation.
  • With low interest rates, the total amount that can be borrowed without interest payments becoming a huge burden rises greatly. This is especially important for governments, since they tend to borrow endlessly, without collateral for their loans.
While this very favorable trend in interest rates has been occurring for years, we don’t know precisely how much impact this stimulus is having on the economy. Instead, the situation is the “new normal.” In some ways, the benefit is like traveling down a hill on a skateboard, and not realizing how much the slope of the hill is affecting the speed of the skateboard. The situation goes on for so long that no one notices the benefit it confers.
If the economy is now moving too slowly, what do we expect to happen when interest rates start rising? Even level interest rates become a problem, if we have become accustomed to the economic boost we get from falling interest rates.
2. The cost of oil extraction tends to rise over time because the cheapest to extract oil is removed first. In fact, this is true for nearly all commodities, including metals. 
If costs always remained the same, we could represent the production of a barrel of oil, or a pound of metal, using the following diagram.

Figure 2. Base Case
If production is becoming increasingly efficient, then we might represent the situation as follows, where the larger size “box” represents the larger output, using the same inputs.

Figure 3. Increased Efficiency
For oil and for many other commodities, we are experiencing the opposite situation. Instead of becoming increasingly efficient, we are becoming increasingly inefficient (Figure 4). This happens because deeper wells need to be dug, or because we need to use fracking equipment and fracking sand, or because we need to build special refineries to handle the pollution problems of a particular kind of oil. Thus we need more resources to produce the same amount of oil.

Figure 4. Growing inefficiency (Notice how sizes of shapes differ in Figures 2, 3, and 4.)
Some people might call the situation “diminishing returns,” because the cheap oil has already been extracted, and we need to move on to the more difficult to extract oil. This adds extra steps, and thus extra costs. I have chosen to use the slightly broader term of “increasing inefficiency” because it indicates that the nature of these additional costs is not being restricted.
Very often, new steps need to be added to the process of extraction because wells are deeper, or because refining requires the removal of more pollutants. At times, the higher costs involve changing to a new process that is believed to be more environmentally sound.

Figure 5. An example of what may happen to make inputs in physical goods and services rise. (The triangle shape was chosen to match the shape of the “Inputs of Goods and Services” triangle in Figures 2, 3, and 4.)
The cost of extraction keeps rising, as the cheapest to extract resources become depleted, and as environmental pollution becomes more of a problem.
3. Using more inputs to create the same or smaller output pushes the world economy toward contraction.
Essentially, the problem is that the same quantity of inputs is yielding less and less of the desired final product. For a given quantity of inputs, we are getting more and more intermediate products (such as fracking sand, “scrubbers” for coal-fired power plants, desalination plants for fresh water, and administrators for colleges), but we are not getting as much output in the traditional sense, such as barrels of oil, kilowatts of electricity, gallons of fresh water, or educated young people, ready to join the work force.
We don’t have unlimited inputs. As more and more of our inputs are assigned to creating intermediate products to work around limits we are reaching (including pollution limits), fewer of our resources can go toward producing desired end products. The result is less economic growth. Because of this declining economic growth, there is less demand for commodities. So, prices for commodities tend to drop.
This outcome is to be expected, if increased efficiency is part of what creates economic growth, and what we are experiencing now is the opposite: increased inefficiency.
4. The way workers afford higher commodity costs is primarily through higher wages. At times, higher debt can also be a workaround. If neither of these is available, commodity prices can fall below the cost of production.
If there is a significant increase in the cost of products like houses and cars, this presents a huge challenge to workers. Usually, workers pay for these products using a combination of wages and debt. If costs rise, they either need higher wages, or a debt package that makes the product more affordable–perhaps lower rates, or a longer period for payment.
Commodity costs have been rising very rapidly in the last fifteen years or so. According to a chart prepared by Steven Kopits, some of the major costs of extracting oil began increasing by 10.9% per year, in about 1999.

Figure 6. Figure by Steve Kopits of Westwood Douglas showing trends in world oil exploration and production costs per barrel. CAGR is “Compound Annual Growth Rate.”
In fact, the inflation-adjusted prices of almost all energy and metal products tended to rise rapidly during the period 1999 to 2008 (Figure 7). This was a time period when the amount of mortgage debt was increasing rapidly as lenders began offering home loans with low initial interest rates to almost anyone, including those with low credit scores and irregular income. When debt levels began falling in mid-2008 (related in part to defaulting home loans), commodity prices of all types dropped.

Figure 6. Inflation adjusted prices adjusted to 1999 price = 100, based on World Bank “Pink Sheet” data.
Prices then began to rise once Quantitative Easing (QE) was initiated (compare Figures 6 and 7). The use of QE brought down medium-term and long-term interest rates, making it easier for customers to afford homes and cars.
Courtesy Gail Tverberg, Founder of Our Infinite World (More by Gail Here)

The Stock Markets Are Rigged

Here is a firm that mediates disputes over criminal theft of personal, business and municipal investments, by banksters at our Too Big To Fail Banks.

First-Class Business Done In a First-Class Way

Tavakoli Structured Finance® (TSF) founded in 2003, is the leading independent risk consulting and expert witness services firm for derivatives, credit derivatives, synthetic collateralized debt obligations, total return swaps, special purpose entities, foreign exchange derivatives, and structured finance. TSF does risk management and expert witness consulting.

“You give up things when you engage Janet Tavakoli. Things like jargon, irrelevant analysis, and poor decisions.”

Risk management topics include both systemic and balance sheet risk mitigation as well as accounting issues. TSF also aids financial institutions in dispute negotiations to agree on satisfactory financial outcomes without the need for time-consuming litigation.

Consulting Services

Consultation topics include trading strategies, reducing funding costs, hedging strategies, identifyinginaccurately rated products, accounting issues, economic capital requirements, documentation, risk management, product development, and global investor demand.

TSF has given early warning on earnings manipulation, undisclosed risks, cash flow problems, liquidity problems, solvency problems, aggressive or fraudulent accounting practices, inaccurately rated products, over-leveraged companies, and various financial anomalies at high profile corporations and financial institutions.

Expert Witness Services

TSF has an unbroken track record of successful outcomes for clients as an expert witness. Consolidated claims include a case for $550 million and another for $1.2 billion.