Peter Schiff Warns: “The Whole Economy Has Imploded… Collapse Is Coming”
Peter Schiff Warns: “The Whole Economy Has Imploded… Collapse Is Coming”
Back before 2008 Peter Schiff was harshly criticized and laughed at for his predictions about a coming economic collapse. Among other things Schiff warned that consumer spending had hit a wall, stocks were overpriced and lax credit lending practices would lead to a detonation of the banking system. Rather than heed the warnings, the biggest names in mainstream media tried to discredit him for not toeing the official narrative. Shortly thereafter, of course, Schiff was vindicated and much of the doom he had forecast came to pass.
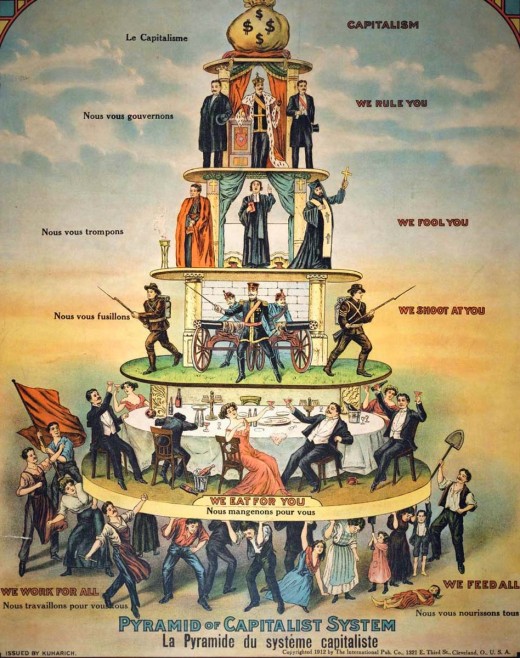
Pyramid of Capitalism
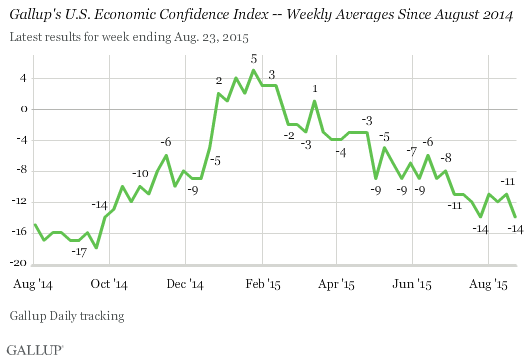
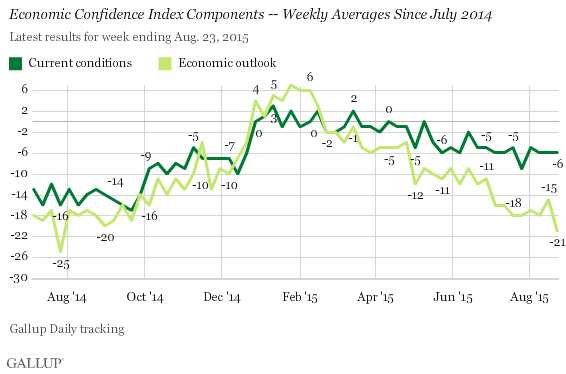
Today, Schiff continues to argue that the economy is on a downhill trajectory and this time there’ll be no stopping it. All of the emergency measures implemented by the government following the Crash of 2008 were merely temporary stop-gaps. The light at the end of the tunnel being touted by officials as recovery, Schiff has famously said, is actually an oncoming train. And if the forecast he laid out in his latest interview is as accurate as those he shared in 2007, then the the train is about to derail.
We’re broke. We’re basically living off of debt. We’ve had a huge transformation of the American economy. Look at all the Americans now on food stamps, on disability, on unemployment.
The whole economy has imploded… the bottom hasn’t dropped out yet because we’re able to go deeper into debt. But the collapse is coming.
Fundamentally, America is worse off now than it was pre-crash. With the national debt rising unabated and money being printed out of thin air without reprieve, it is only a matter of time.
Schiff notes that while government statistics claim Americans are saving again and consumers seem to be spending, the average Joe Sixpack actually has a negative net worth. But most people don’t even realize what’s happening:
I read a statistic… The average American has less than a $5000 net worth… it’s pathetic… we’re basically broke… but in fact it’s much less… If you actually took the national debt and broke it down per capita, the average American has a negative net worth because the government has borrowed in his name more than the average American is able to save.
What’s happening is pretty much what we would anticipate. I don’t see from the data any real economic recovery, certainly not in the United States.
We’re spending more money, but it’s not because we’re generating more wealth. We’re generating more debt. We’re using that borrowed money to consume and so temporarily it feels that we’re wealthier because we get to spend all that money… but we have to come to terms with paying the bill.
The bills are going to come due. Right now interest rates are being kept at zero which makes it possible to service the debt even though it’s impossible to repay it… at least we can service it. But once interest rates go up then we can’t even service it let alone repay it.
And then the party is going to come to an end.
The problem, of course, is that no one with any real influence over public perception, like our elected officials or the media, will do anything about it. They’ll continue the party until it comes to an abrupt and irreversible end, and anyone who goes against the official narrative will be branded a lunatic gloom and doomer or extremist.
But vilifying those who are blaring the warning sirens will do nothing to change the end result:
We’re going to have a crisis… There are always going to be people who say ‘well, you’re a stopped clocked… you keep predicting doom and eventually it happens’… but you have to back and listen to why… Why are they saying it?
If you look back at things that I’ve said and the things that Ron Paul has said… This is why it’s happening… it’s not like we’re just saying negative things to be negative and then when something negative happens we can claim credit for it happening.
If you look back at the events it bears out that we’re right… unfortunately our opinions are in the minority… and you have governments that have a vested interest in ignoring these opinions because they don’t want to change because they’re at the root cause of the problem. But they don’t want to acknowledge their role in creating the problem. They don’t want to acknowledge that the problem is more government and that we need less government because that’s not how they stay in power. They promise something for nothing… they promise that government is the solution for your problems, not the cause of your problems.
They’re never going to acknowledge people like Ron Paul for what they’re saying… but they’ll try to discredit you by saying ‘well, you’ve been saying this for years and nothing bad has happened.’
But look around. A lot of bad stuff has happened. We just haven’t had the final and complete collapse. But what good is it when that happens? Now it’s too late to do anything about it.
The reality is that the American economy is on its last leg. Black Friday sales were pitiful, some of the world’s leading companies are warning of recession, and U.S. national debt will soon surpass $20 Trillion.
Just as was the case before the Crash of 2008, all of the signs are there. And just like before, the stock market continues to hover near all-time highs.
If you’ve been paying attention you know what happens next.