Why are commodity prices, including oil prices, lagging? Ultimately, the question comes back to, “Why isn’t the world economy making very many of the end products that use these commodities?” If workers were getting rich enough to buy new homes and cars, demand for these products would be raising the prices of commodities used to build and operate cars, including the price of oil. If governments were rich enough to build an increasing number of roads and more public housing, there would be demand for the commodities used to build roads and public housing.
It looks to me as though we are heading into a deflationary depression, because the prices of commodities are falling below the cost of extraction. We need rapidly rising wages and debt if commodity prices are to rise back to 2011 levels or higher. This isn’t happening. Instead, Janet Yellen is talking about raising interest rates later this year, and we are seeing commodity prices fall further and further. Let me explain some pieces of what is happening.
1. We have been forcing economic growth upward since 1981 through the use of falling interest rates. Interest rates are now so low that it is hard to force rates down further, in order to encourage further economic growth.
Falling interest rates are hugely beneficial for the economy. If interest rates stop dropping, or worse yet, begin to rise, we will lose this very beneficial factor affecting the economy. The economy will tend to grow even less quickly, bringing down commodity prices further. The world economy may even start contracting, as it heads into a deflationary depression.
If we look at 10-year US treasury interest rates, there has been a steep fall in rates since 1981.
Figure 1. Chart prepared by St. Louis Fed using data through July 20, 2015.
In fact, almost any kind of interest rates, including interest rates of shorter terms, mortgage interest rates, bank prime loan rates, and Moody’s Seasoned AAA Bonds, show a fairly similar pattern. There is more variability in very short-term interest rates, but the general direction has been down, to the point where interest rates can drop no further.
Declining interest rates stimulate the economy for many reasons:
- Would-be homeowners find monthly payments are lower, so more people can afford to purchase homes. People already owning homes can afford to “move up” to more expensive homes.
- Would-be auto owners find monthly payments lower, so more people can afford cars.
- Employment in the home and auto industries is stimulated, as is employment in home furnishing industries.
- Employment at colleges and universities grows, as lower interest rates encourage more students to borrow money to attend college.
- With lower interest rates, businesses can afford to build factories and stores, even when the anticipated rate of return is not very high. The higher demand for autos, homes, home furnishing, and colleges adds to the success of businesses.
- The low interest rates tend to raise asset prices, including prices of stocks, bonds, homes and farmland, making people feel richer.
- If housing prices rise sufficiently, homeowners can refinance their mortgages, often at a lower interest rate. With the funds from refinancing, they can remodel, or buy a car, or take a vacation.
- With low interest rates, the total amount that can be borrowed without interest payments becoming a huge burden rises greatly. This is especially important for governments, since they tend to borrow endlessly, without collateral for their loans.
While this very favorable trend in interest rates has been occurring for years, we don’t know precisely how much impact this stimulus is having on the economy. Instead, the situation is the “new normal.” In some ways, the benefit is like traveling down a hill on a skateboard, and not realizing how much the slope of the hill is affecting the speed of the skateboard. The situation goes on for so long that no one notices the benefit it confers.
If the economy is now moving too slowly, what do we expect to happen when interest rates start rising? Even level interest rates become a problem, if we have become accustomed to the economic boost we get from falling interest rates.
2. The cost of oil extraction tends to rise over time because the cheapest to extract oil is removed first. In fact, this is true for nearly all commodities, including metals.
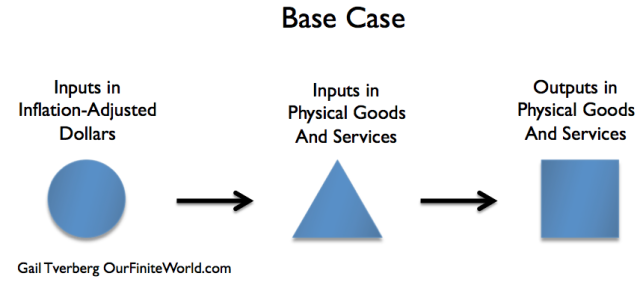
If costs always remained the same, we could represent the production of a barrel of oil, or a pound of metal, using the following diagram.
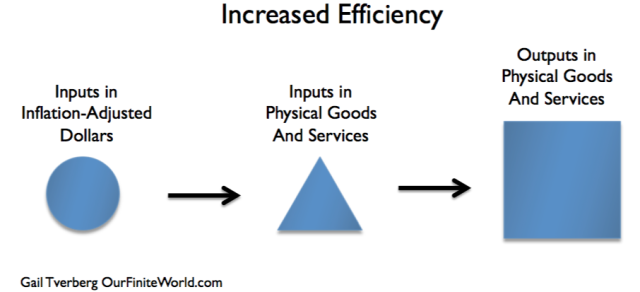
If production is becoming increasingly efficient, then we might represent the situation as follows, where the larger size “box” represents the larger output, using the same inputs.
Figure 3. Increased Efficiency
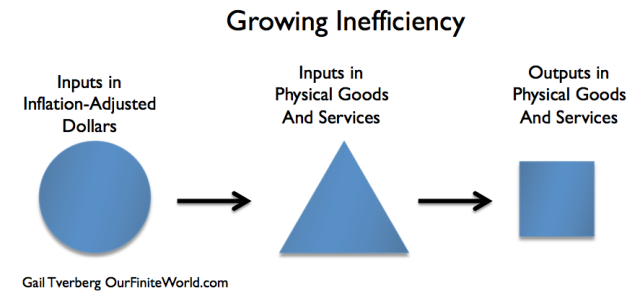
For oil and for many other commodities, we are experiencing the opposite situation. Instead of becoming increasingly efficient, we are becoming increasingly inefficient (Figure 4). This happens because deeper wells need to be dug, or because we need to use fracking equipment and fracking sand, or because we need to build special refineries to handle the pollution problems of a particular kind of oil. Thus we need more resources to produce the same amount of oil.
Figure 4. Growing inefficiency (Notice how sizes of shapes differ in Figures 2, 3, and 4.)
Some people might call the situation “diminishing returns,” because the cheap oil has already been extracted, and we need to move on to the more difficult to extract oil. This adds extra steps, and thus extra costs. I have chosen to use the slightly broader term of “increasing inefficiency” because it indicates that the nature of these additional costs is not being restricted.
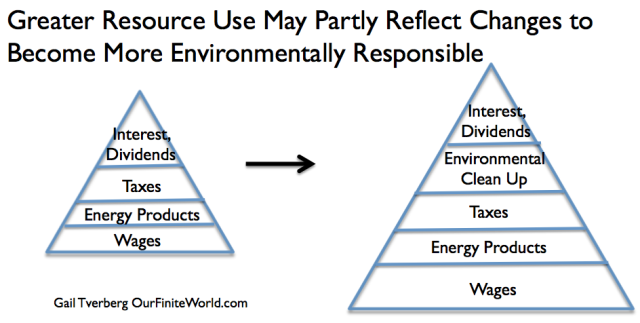
Very often, new steps need to be added to the process of extraction because wells are deeper, or because refining requires the removal of more pollutants. At times, the higher costs involve changing to a new process that is believed to be more environmentally sound.
Figure 5. An example of what may happen to make inputs in physical goods and services rise. (The triangle shape was chosen to match the shape of the “Inputs of Goods and Services” triangle in Figures 2, 3, and 4.)
The cost of extraction keeps rising, as the cheapest to extract resources become depleted, and as environmental pollution becomes more of a problem.
3. Using more inputs to create the same or smaller output pushes the world economy toward contraction.
Essentially, the problem is that the same quantity of inputs is yielding less and less of the desired final product. For a given quantity of inputs, we are getting more and more intermediate products (such as fracking sand, “scrubbers” for coal-fired power plants, desalination plants for fresh water, and administrators for colleges), but we are not getting as much output in the traditional sense, such as barrels of oil, kilowatts of electricity, gallons of fresh water, or educated young people, ready to join the work force.
We don’t have unlimited inputs. As more and more of our inputs are assigned to creating intermediate products to work around limits we are reaching (including pollution limits), fewer of our resources can go toward producing desired end products. The result is less economic growth. Because of this declining economic growth, there is less demand for commodities. So, prices for commodities tend to drop.
This outcome is to be expected, if increased efficiency is part of what creates economic growth, and what we are experiencing now is the opposite: increased inefficiency.
4. The way workers afford higher commodity costs is primarily through higher wages. At times, higher debt can also be a workaround. If neither of these is available, commodity prices can fall below the cost of production.
If there is a significant increase in the cost of products like houses and cars, this presents a huge challenge to workers. Usually, workers pay for these products using a combination of wages and debt. If costs rise, they either need higher wages, or a debt package that makes the product more affordable–perhaps lower rates, or a longer period for payment.
Commodity costs have been rising very rapidly in the last fifteen years or so. According to a chart prepared by Steven Kopits, some of the major costs of extracting oil began increasing by 10.9% per year, in about 1999.
Figure 6. Figure by Steve Kopits of Westwood Douglas showing trends in world oil exploration and production costs per barrel. CAGR is “Compound Annual Growth Rate.”
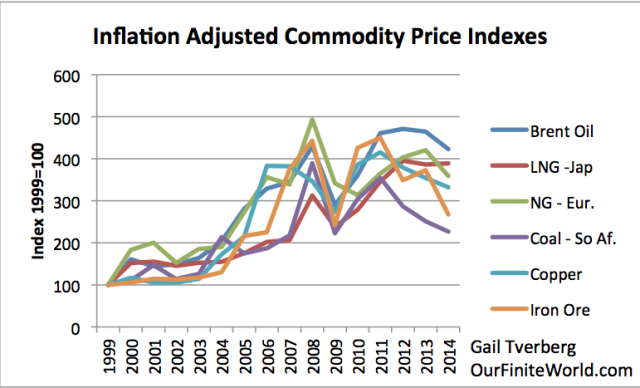
In fact, the inflation-adjusted prices of almost all energy and metal products tended to rise rapidly during the period 1999 to 2008 (Figure 7). This was a time period when the amount of mortgage debt was increasing rapidly as lenders began offering home loans with low initial interest rates to almost anyone, including those with low credit scores and irregular income. When debt levels began falling in mid-2008 (related in part to defaulting home loans), commodity prices of all types dropped.
Figure 6. Inflation adjusted prices adjusted to 1999 price = 100, based on World Bank “Pink Sheet” data.
Prices then began to rise once Quantitative Easing (QE) was initiated (compare Figures 6 and 7). The use of QE brought down medium-term and long-term interest rates, making it easier for customers to afford homes and cars.